Diagnostics
Browser-console diagnostics
Detailed page. Use “On this page” to jump directly to the section you need.
Use this guide when a Lightning card result is missing, wrong, or unclear and you need the
authorized [RHC] evidence shown in the browser console.
Diagnose problems with the Lightning card, Check configuration, Salesforce access, Flow, Apex, background jobs, and Platform Events. Start with the result users see, collect only the evidence you are authorized to view, and turn diagnostics off when the investigation is complete.
Reference
- This page is the primary troubleshooting runbook for Record Health Check.
- For every other Check Set field, use the Configure Check Sets and Checks.
Use this guide whenever Record Health Check does not load, run, evaluate, publish, or behave the same way for two users. Start with the decision table below. Enable Show Diagnostics only when the card and current user’s access are part of the investigation.
Show Diagnostics adds on-screen and browser-console evidence for the current run. It does not save history, change Salesforce data, or grant access by itself. Leave it off on production Check Sets when the investigation is complete.
Salesforce administrators can normally stop after the card, configuration, access, and browser console sections. Continue into debug logs, background jobs, and integration evidence only when a developer or automation owner needs help with one of those options. If you use only the Lightning card, skip the non-card and Platform Event sections.
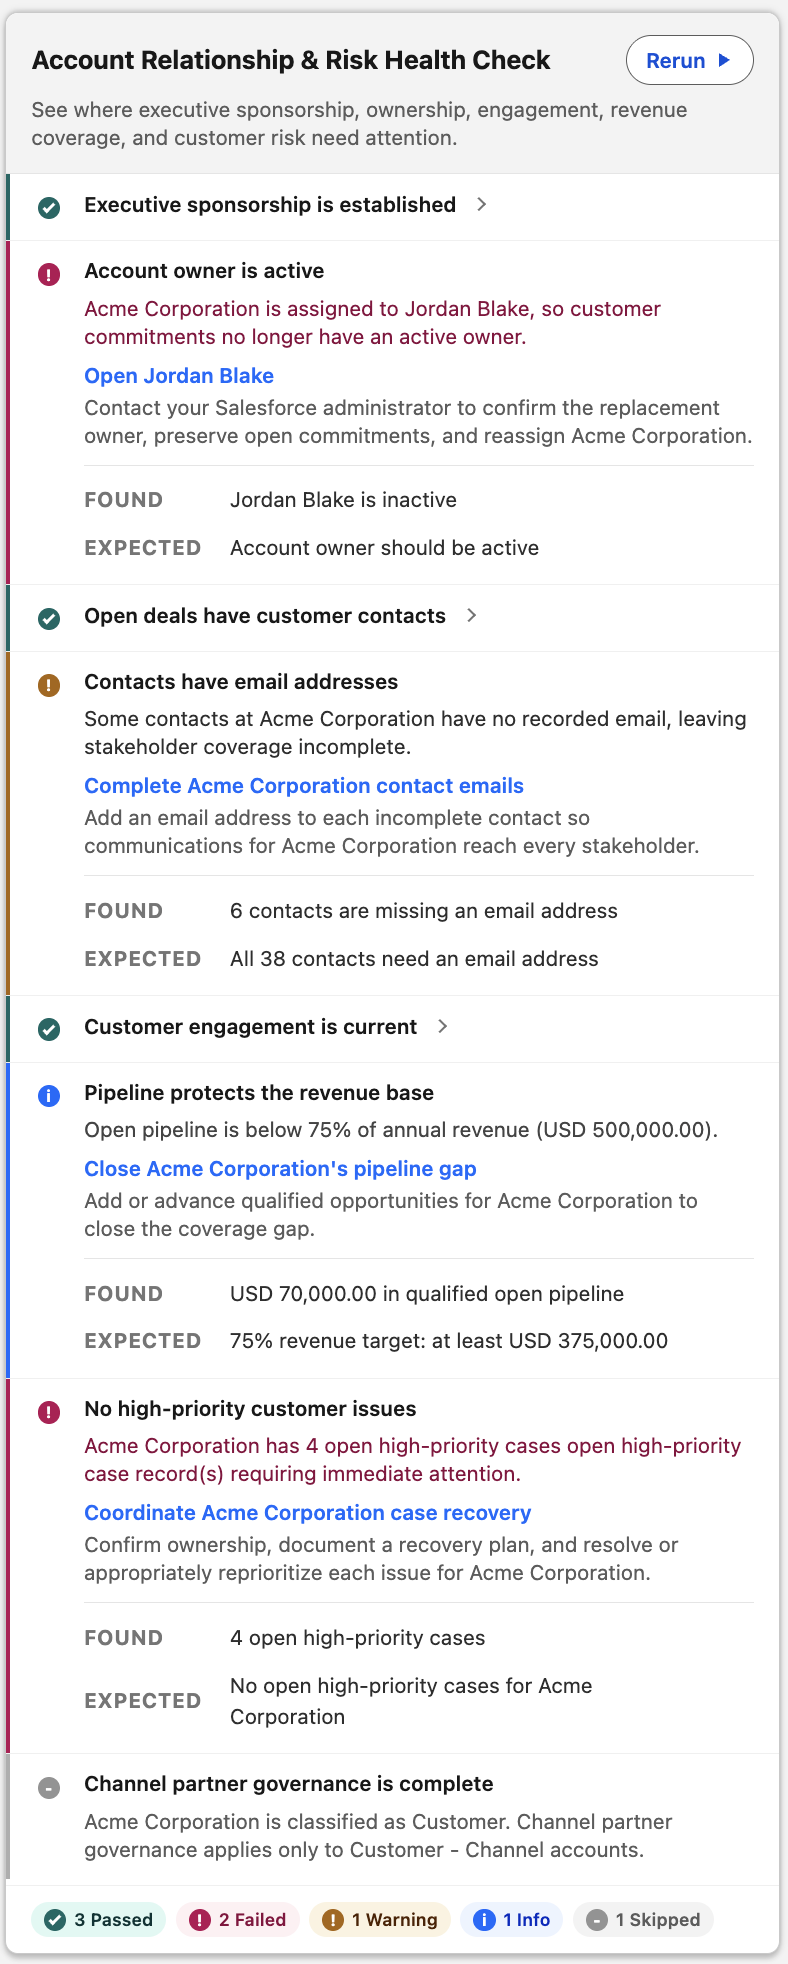
For what a normal (non-diagnostics) card looks like with Pass, Fail, and Skipped outcomes, see the Demo Account Relationship and Risk screenshot on Install and verify.
What you will learn
Section titled “What you will learn”| Question | Answer on this page |
|---|---|
| Why does checking Show Diagnostics appear to do nothing? | The viewer also needs a direct Record Health Check Diagnostics Viewer or Record Health Check Admin assignment |
| What changes on the card? | Authorized troubleshooting lines and details appear after a run |
| What appears in the browser console? | One [RHC] summary; only results needing review receive per-Check groups, and full support evidence is reserved for technical outcomes |
| How do I return to normal operation? | Uncheck Show Diagnostics and remove temporary administrator access when appropriate |
Start with the symptom users see
Section titled “Start with the symptom users see”Do not begin by changing the Check. Reproduce the problem once and record the exact time, running user, Salesforce record, Check Set Qualified API Name, and Run ID. Then choose the matching row.
Copy the Check Set Qualified API Name from its Custom Metadata record in Setup. Copy the Run ID
from the authorized Diagnosis or [RHC] browser-console summary after the run finishes.
| Symptom | Check first | Likely cause area | Go to |
|---|---|---|---|
| Card is missing, empty, or says no Check Set is configured | App Builder Check Set selection and Check Set identity | Lightning page or metadata selection | Card and definition problems |
| Run button is absent | When Checks Run and Run Button Display on the Check Set | Intended card configuration | Card and definition problems |
| One user succeeds and another does not | Permission Sets, record sharing, object access, and field access | Salesforce authorization | Access differences |
| Check is Skipped | Reason Code and prerequisite/applicability diagnostics | Applicability or dependency | Read the result first |
| Check is Unable to Check | Reason Code, troubleshooting detail, and source details | Data, access, query, formula, or limit | Show Diagnostics |
| Check shows System Error | Expanded Diagnosis and Diagnostic ID | Configuration, custom Apex, or Record Health Check | Read the diagnosis |
| Flow action faults or returns an aligned error | Flow interview details and returned category/message | Flow input, grouping, size, or evaluation | Flow action inputs and outputs |
| Apex call throws | Exception type/message and calling request | Invalid request, missing authorization, or prohibited custom Apex behavior | Salesforce debug logs |
| Queueable, Batch, or Scheduled job fails | Async job status plus the submitting/running user’s debug log | Submission, scope, or finalization | Salesforce debug logs |
| Expected Platform Event never arrives | Publication option, Check settings, event access, and receiving automation logs | Event publication or receiving Flow, Apex, or integration | Platform Event publication |
Read the result first
Section titled “Read the result first”Status and Reason Code are the fastest route to the correct layer:
| Status | Meaning | Troubleshooting posture |
|---|---|---|
| Pass | The Check ran and its condition was met | Investigate only if the business expectation or displayed value is wrong |
| Fail | The Check ran and its condition was not met | Inspect Found, Expected, operator, and Check configuration; this is normally not a system defect |
| Skipped | The Check did not apply | Inspect applicability, prerequisite, and no-row behavior |
| Unable to Check | Record Health Check could not reach a reliable result | Inspect access, missing data, query or formula validity, and limits |
| System Error | Configuration or execution is broken | Open Diagnosis, follow its fix and verification steps, and retain the Diagnostic ID |
Look up the exact machine value in Reason Codes. Do not reinterpret Unable or Skipped as Fail; each means a different remediation and automation outcome.
Read the diagnosis
Section titled “Read the diagnosis”For every catchable System Error or Unable result, an authorized administrator receives a structured Diagnosis on the card. The card answers the first three questions; the matching browser-console group completes the sequence:
- What failed? A plain-language headline and safe summary.
- Where? The lifecycle phase, component, Check, and, when Salesforce supplies it, Apex method and line.
- Why? The classified likely cause, not merely
APEX_EVALUATOR_ERROR. - How do I fix it? One or more actions tailored to configuration, access, query, formula, plugin contract, limits, or framework failure.
- How do I verify it? A concrete rerun or configuration validation step.
- How do I match the evidence? A Diagnostic ID and Run ID that are safe to copy into a support case.
In the browser console, expand Support report for this check and copy the structured report when you need to escalate. Review it before sharing: it can contain record and user IDs, queries, source values, and customer data. The card itself intentionally shows only the concise diagnosis.
Debug logs are last-resort escalation evidence for an uncatchable platform limit, a Salesforce internal error, or a novel framework defect whose diagnosis explicitly says telemetry is incomplete. They are not the normal troubleshooting workflow.
Review configuration before collecting developer evidence
Section titled “Review configuration before collecting developer evidence”When several records fail the same way, compare the Check Set and Check with Configure Check Sets and Checks and the appropriate Evaluation Type reference. Confirm the exact Setup labels, API names, active settings, Evaluation Order, query fields, operators, empty-result choices, and prerequisites. A correct configuration still requires testing as the intended user because administrators can see records and fields other users cannot.
Card and definition problems
Section titled “Card and definition problems”- In Lightning App Builder, confirm the component’s Check Set value matches the intended Custom Metadata Developer Name.
- Confirm the Check Set is active, uses the record’s object API name, and has at least one active Check in the selected whole-set run.
- Treat a hidden Run button as configuration until proven otherwise. Check When Checks Run, Run Button Display on the selected Check Set. Hidden and icon-only controls intentionally release their unused header space to the title.
- Remember that a real record page loads lightweight shell configuration after the initial quiet render. An inactive or missing Check Set can therefore fail before a Manual user selects Run; definitions and evaluation still remain deferred until Run. App Builder can provide a sample record ID, but the preview ignores it. A configured preview loads only the selected Check Set’s lightweight shell label and active/inactive counts; it does not load definitions or evaluate Checks.
- Refresh the record page after metadata, permission, or Lightning-page changes.
- If definition loading still fails, capture the card’s Diagnostic ID and copied diagnostic report. Use a debug log only if the diagnosis reports incomplete telemetry.
Access differences between users
Section titled “Access differences between users”Compare users without granting broad administrator access permanently:
- the baseline card user needs Record Health Check Card User; add Record Health Check Diagnostics Viewer temporarily when that user must reproduce an issue with authorized detail;
- Show Diagnostics additionally requires the direct packaged Permission Set assignment described below;
- record sharing and object/field permissions remain those of the running user;
- a custom Apex Check must query with the running user’s access; and
- a Flow, Apex trigger, or integration receiving a Platform Event needs separate access to that event.
Test as the affected user whenever possible. A System Administrator success does not establish that the intended user has the required access.
Turning on Show Diagnostics on the Check Set alone does nothing visible. Both the Check Set flag and a direct Record Health Check Diagnostics Viewer or Record Health Check Admin Permission Set assignment are required for troubleshooting output.
Both steps are required
Section titled “Both steps are required”If the Diagnostics Viewer Permission Set is absent from Setup, assign Record Health Check Admin in step 2 instead. Diagnostics is authorized by the packaged assignment itself, so an org-owned or cloned Permission Set cannot grant it. See Permission Sets for the access each set grants.
| Step | What to do | Where in Setup |
|---|---|---|
| 1. Check Set | Check Show Diagnostics | Custom Metadata Types → Record Health Check Set → open your Check Set → Show Diagnostics (ShowDiagnostics__c) |
| 2. User | Assign Record Health Check Diagnostics Viewer (rhc__Record_Health_Check_Diagnostics_Viewer) alongside the user’s existing runner Permission Set | Permission Sets → open Record Health Check Diagnostics Viewer (rhc__Record_Health_Check_Diagnostics_Viewer) → Manage Assignments → add the troubleshooting user |
Step 2 authorizes advanced detail. The Check Set’s Show Diagnostics flag then decides when that detail appears on the card and in the console.
Assign the packaged Record Health Check Diagnostics Viewer Permission Set alongside the user’s existing runner Permission Set. Record Health Check Admin also authorizes diagnostics, but reserve Admin for people who maintain or validate Check configuration. The assignment must be direct and active: an installation profile grant, a cloned Permission Set, or Permission Set Group membership alone does not authorize diagnostics.
The two controls answer different questions. Show Diagnostics lets an administrator choose which Check Sets may produce troubleshooting output. The Permission Set assignment decides which users may see it. Requiring both prevents a configuration change from exposing record identifiers, timing, Reason Codes, source details, or access failures to every user of the Lightning page.
Which Permission Set unlocks troubleshooting detail?
Section titled “Which Permission Set unlocks troubleshooting detail?”| Permission Set | API name | Can run checks | Authorizes diagnostics |
|---|---|---|---|
| Record Health Check Card User | rhc__Record_Health_Check_Card_User | Card only | No |
| Record Health Check User | rhc__Record_Health_Check_User | Yes | No |
| Record Health Check Admin | rhc__Record_Health_Check_Admin | Yes | Yes |
| Record Health Check Diagnostics Viewer | rhc__Record_Health_Check_Diagnostics_Viewer | No; combine with Card User or User | Yes, and nothing else |
If you checked Show Diagnostics on the Check Set but still see a normal card, confirm that the viewing user has Record Health Check Diagnostics Viewer or Record Health Check Admin. Also confirm that the user still has a runner Permission Set appropriate to the entry point.
What diagnostics access unlocks
Section titled “What diagnostics access unlocks”A direct Record Health Check Diagnostics Viewer or Record Health Check Admin assignment authorizes advanced result and troubleshooting information.
| Capability | Diagnostics access required | Show Diagnostics required | What the authorized user receives |
|---|---|---|---|
| Formula Passes when | Yes | No | The Formula Check’s pass condition when the row uses the default Formula comparison display. Users without diagnostics access see the business message instead of the formula expression. |
| Result troubleshooting line | Yes | Yes | Status, Reason Code, duration, and Evaluation Type beneath each result. |
| Diagnosis | Yes | Yes | A concise Issue, Where, and Why explanation for UNABLE_TO_EVALUATE or ERROR. |
| Browser-console prompt | Yes | Yes | A reminder that full technical evidence and next steps are available in the browser console. |
[RHC] run summary | Yes | Yes | Run identity, outcome counts, timing, and ordered next steps. A completely passing run states that no diagnostic issues were found and does not create per-Check groups. |
| Results needing review | Yes | Yes | A concise collapsed group for each Fail, Skipped, Unable to Check, or System Error result. Passing Checks are omitted from console detail. |
| Advanced diagnostics and support report | Yes | Yes | Technical evidence for UNABLE_TO_EVALUATE and ERROR only. Ordinary business Fail and Skipped results remain concise and do not produce a support bundle. |
Diagnostics access does not grant record or field access. Record Health Check still uses the running user’s Salesforce access, and diagnostic output can describe only information the user was allowed to evaluate.
After changing the Check Set or Permission Set assignment, refresh the record page.
What you see on the Record Health Check card
Section titled “What you see on the Record Health Check card”After you run the checks (automatic or manual), and only when both steps above are complete:
| What | Description |
|---|---|
| Gray line under each result | Compact summary, for example FAIL · FORMULA_FALSE · 38ms · Formula: Status, Reason Code, duration, and Evaluation Type (API value). |
| Diagnosis | An automatically expanded explanation limited to Issue, Where, and Why. Remediation, verification, IDs, and evidence stay in the browser console. |
| Found / Expected | On failing checks, labelled chips when the engine captured values. Found / Expected visibility is controlled by Found/Expected Display on the Check Set. |
| Found and Expected source details | For Unable to Check and System Error outcomes, source details may be included in the browser console’s Advanced diagnostics group. Business Fail and Skipped results do not produce that technical bundle. |
| Console hint | Small footnote directing technical users to the browser console (F12) for evidence and next steps. |
Users without a Record Health Check Diagnostics Viewer or Record Health Check Admin assignment never see the gray lines, Diagnosis panels, or the console hint: even when Show Diagnostics is checked on the Check Set. This is intentional so technical detail is not exposed to everyday users.
What you see in the browser console
Section titled “What you see in the browser console”- Open a record page that has the Record Health Check card.
- Press F12 (Windows/Linux) or Command-Option-I (macOS), then select the Console tab.
- Run the Check Set from the card.
- When the run finishes, find a group titled
[RHC] <CheckSetDeveloperName> · <outcome summary>.
The group shows the Run ID and ordered next steps. Use the Check Set Developer Name in its title to distinguish multiple Record Health Check cards on the same Lightning record page.
| Console entry | What it contains |
|---|---|
| Outcome summary | A count such as 3 Passed, 2 Failed · 847ms total. |
| Next steps | Ordered plain-language guidance. System Error guidance appears before Unable, Fail, or Skipped guidance. |
| Results needing review | Every non-Pass result, ordered with System Error, Unable, Fail, and Skipped. Passing Checks do not create per-Check console noise. |
| Check summary | Readable Status, Severity, Reason Code, Evaluation Type, duration, Issue, Where, Why, Fix, and Verify lines when available. |
| Advanced diagnostics | For Unable to Check or System Error only, a collapsed JSON view with the Check name, configuration, values, source details, server diagnosis, and complete result returned by the server. |
| Support report for this check | For Unable to Check or System Error only, a collapsed standalone JSON report for the Check plus the Run ID and Set details needed to identify it. Review and redact it before sharing. |
For a Fail or Skipped result, read the concise Check summary and correct the business data, applicability, prerequisite, or configuration. Those expected outcomes are not system incidents and do not receive an advanced support bundle. For Unable to Check or System Error, expand only the technical Check you need. Its summary separates Issue, Where, Why, Fix, and Verify. Expand Advanced diagnostics only when that summary is not enough. It can contain query templates, merged record identifiers, prepared execution queries, source values, customer data, and the Diagnostic ID, and must be reviewed before it is shared.
For a query that runs separately for each record, Advanced diagnostics shows the prepared query
that execution used. Its LIMIT is Max Query Rows + 1 because Record Health Check reads one
extra row to determine whether the configured maximum was exceeded.
Use the Diagnostic ID and Run ID to match the card, console, Agentforce or API response, and structured Log event. Open a Salesforce debug log only when the diagnosis explicitly lacks enough evidence for resolution. The console prints a redaction reminder inside each technical support-report group. Record and User IDs, queries, source values, and customer data can still be present; “support report” does not mean “safe to publish without review.”
Add Salesforce evidence
Section titled “Add Salesforce evidence”Use Salesforce debug logs only when the card diagnosis and reviewed browser-console support report do not identify the failed phase and corrective action.
For failures outside the Lightning card, use the guide for the way Record Health Check was run:
Escalation package
Section titled “Escalation package”Before escalating, collect one coherent evidence set rather than unrelated screenshots:
- package version or installed
04t, org type, and namespace shape; - entry point, execution user, exact timestamp and timezone;
- Check Set and Check Qualified API Names, record object, and redacted record ID;
- Run ID, status, Reason Code, and visible message;
- redacted browser-console group and matching debug-log excerpt;
- Flow interview, background job, or receiving-automation identifier when applicable; and
- the smallest metadata configuration that reproduces the problem.
Never include session IDs, access/refresh tokens, authentication URLs, passwords, or customer data.
What to capture for a bug report
Section titled “What to capture for a bug report”For a behavior or evaluation issue, reproduce the problem with Show Diagnostics enabled and include the following evidence:
- the expected behavior and the actual behavior;
- exact reproduction steps;
- the Check Set Qualified API Name and Check Developer Name;
- the displayed Status, Reason Code, and message;
- the redacted
[RHC]console report; and - a redacted screenshot or screen recording when the problem appears on the card.
If Show Diagnostics cannot be enabled or does not apply, explain why in the report. Also include the
package version or installed 04t, installation type, org type, Salesforce API version, and browser
or device when relevant.
Before sharing evidence, remove customer data, record IDs, Org IDs, session IDs, and access tokens. Redact both screenshots and console output. Security vulnerabilities must be reported privately through the Security policy, not through a public issue.
Checklist
Section titled “Checklist”- Show Diagnostics checked on the same Check Set the component uses (App Builder Check Set selection must match).
- Permission Set Record Health Check Admin (
rhc__Record_Health_Check_Admin) assigned to the user viewing the page. - Record page refreshed after metadata or permission changes.
- Checks run to completion (troubleshooting detail appears after the run, not on first load while rows are still pending).
- Show Diagnostics turned off on production Check Sets when troubleshooting is finished.
Related
Section titled “Related”- Install and verify: first install and permission assignment
- Configuration guide: Check Set fields: every Check Set field
- Configuration guide: Troubleshooting: when a check fails or cannot run